
We're Putting the Power in Your Hands
The Torus Station is constantly optimizing your home’s electricity usage, saving you money, lowering your carbon footprint, and reducing your reliance on the grid. The Torus Mobile App’s new Power Section shows exactly how your system is directing energy throughout your home, providing a simple way to understand your usage, make informed decisions, and build efficient habits.
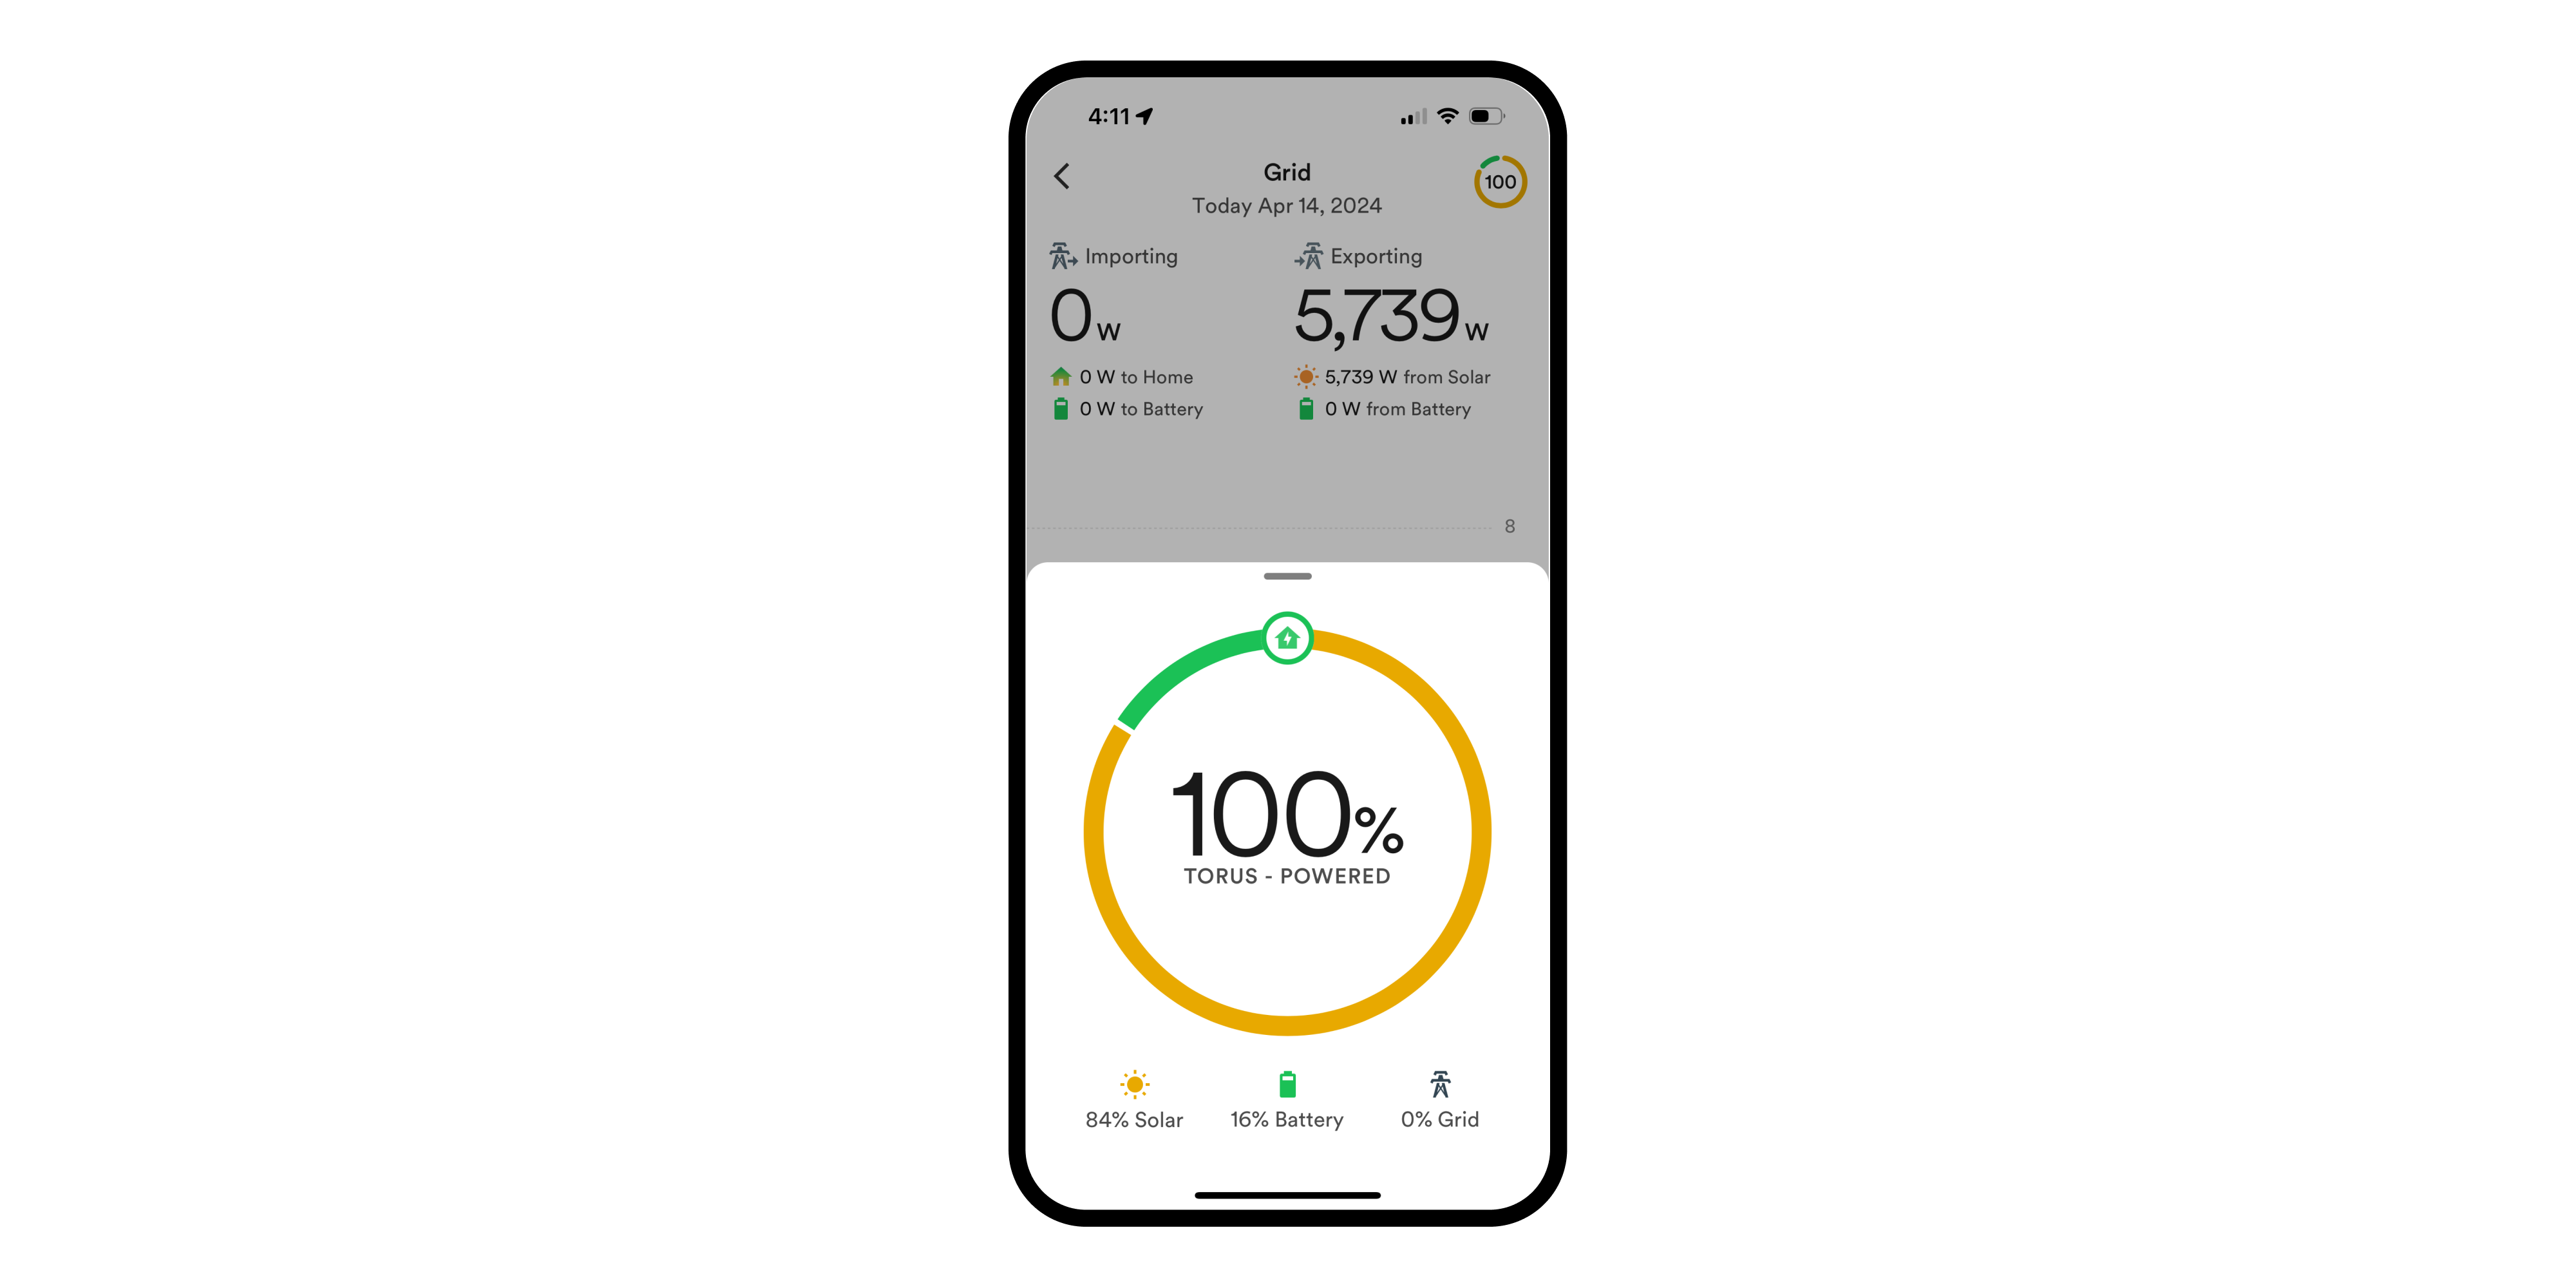
The Power Index Screen
The Power Index Screen provides an at-a-glance overview of your home's grid usage, battery utilization, and solar production for the day. It also displays your current Torus Powered Score, so you can easily see what percent of your energy is coming from each of those three sources.

The Torus Powered Score
The Torus Powered Score is your system’s north star. It quickly shows you how much electricity from the grid you replaced with solar power and battery storage on any given day. Because your Torus Powered Score is such an effective way to track your system’s performance, it’s now included in each Power Report. Simply tap the score in the upper right-hand corner to see a full breakdown.
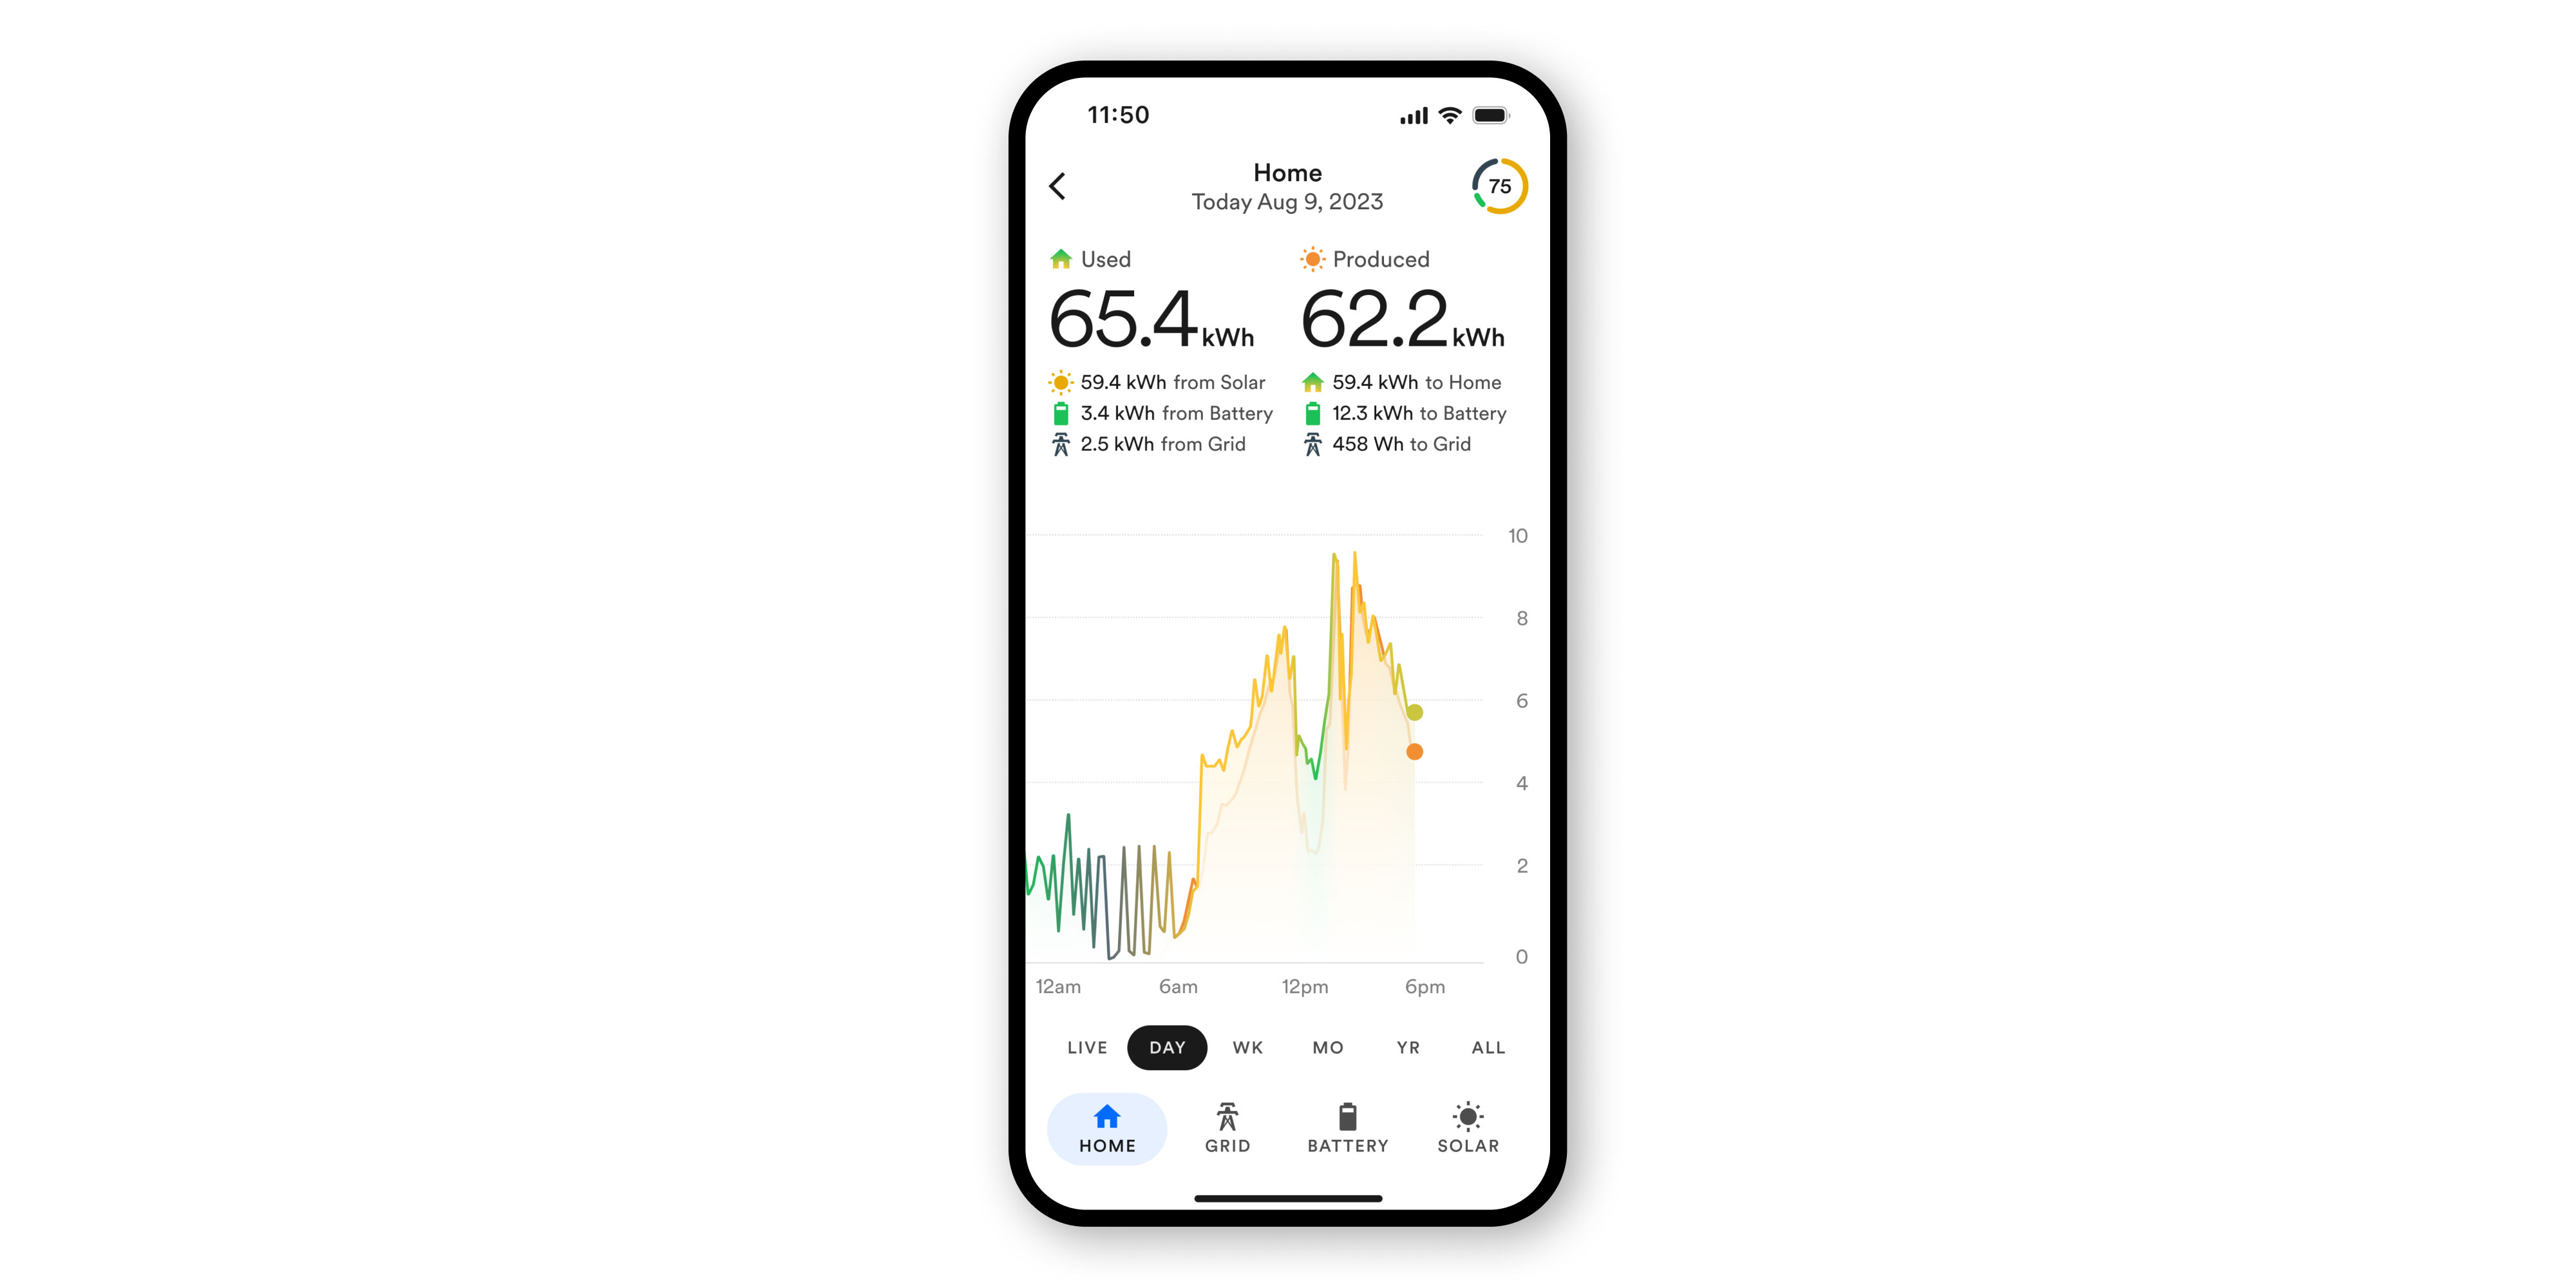
Power Reports
Power Reports show the last 10 minutes of your energy consumption in real time. They also let you track that same data across daily, weekly, monthly, yearly, and all-time views, helping you recognize patterns in your usage.
- The Home Report is a holistic view of how power is flowing throughout your home. It shows how much energy you’re consuming and where that power is coming from—solar panels, battery storage, or the grid. It also shows how much electricity your panels are producing and details whether that energy is being directly consumed, stored in your battery, or sent back to the grid.
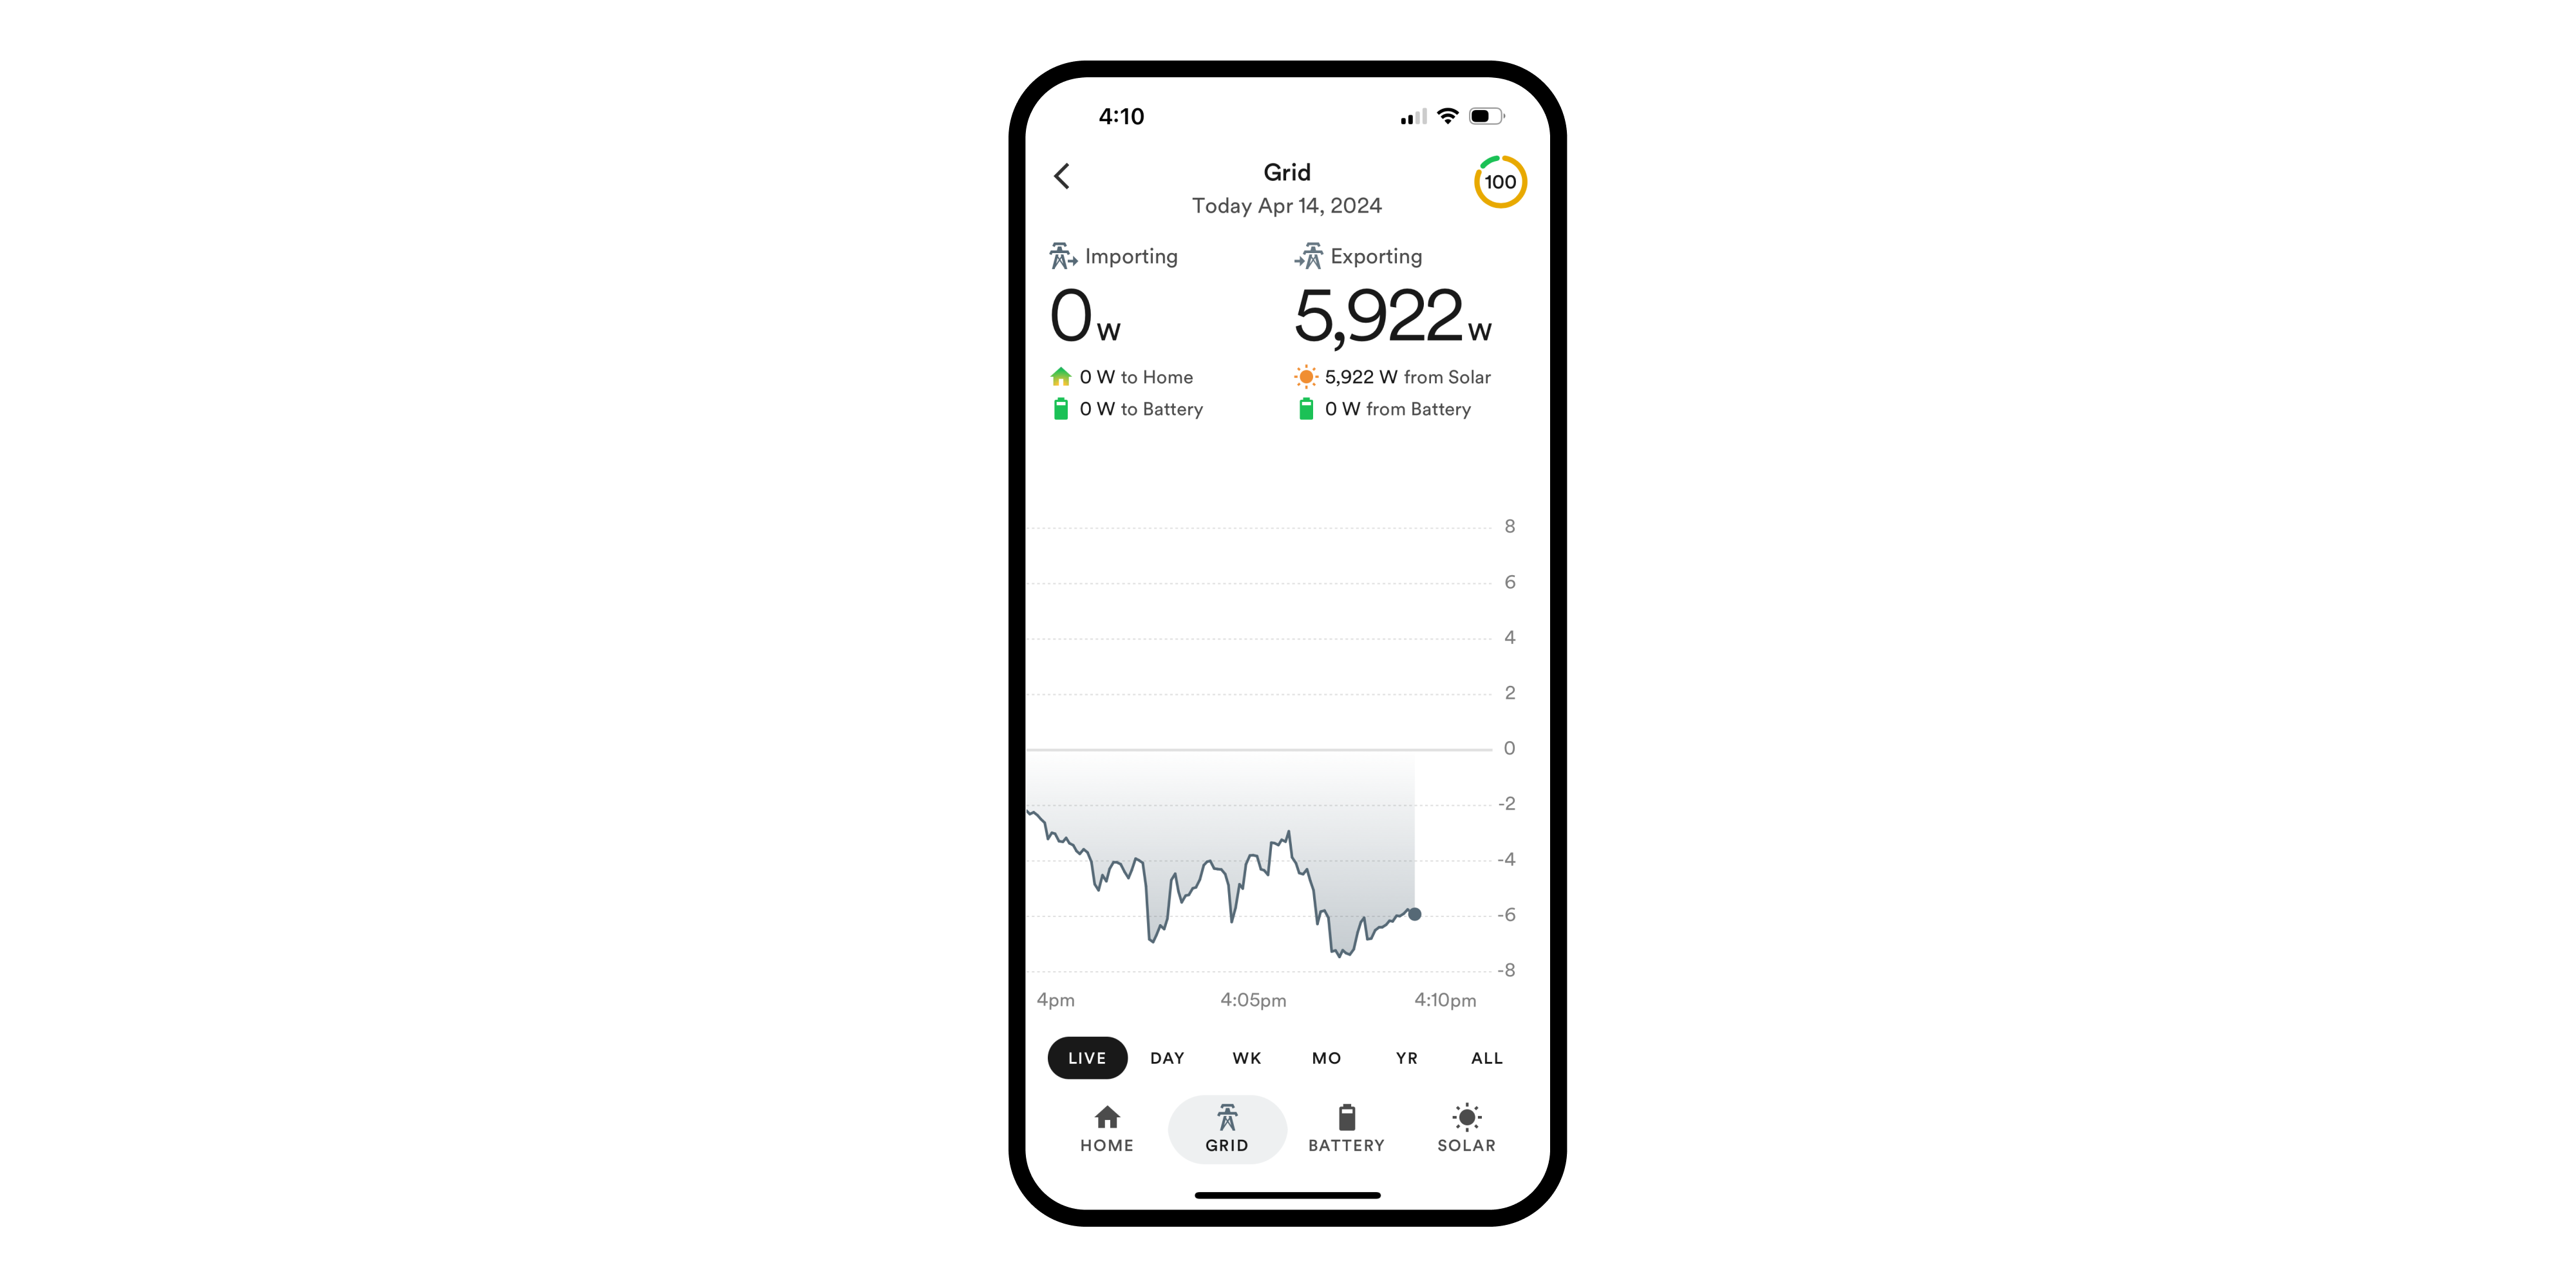
- The Grid Report shows how much power from the grid your home is using, whether that power was directly consumed or stored on your battery, and how much energy you sent back to the grid.
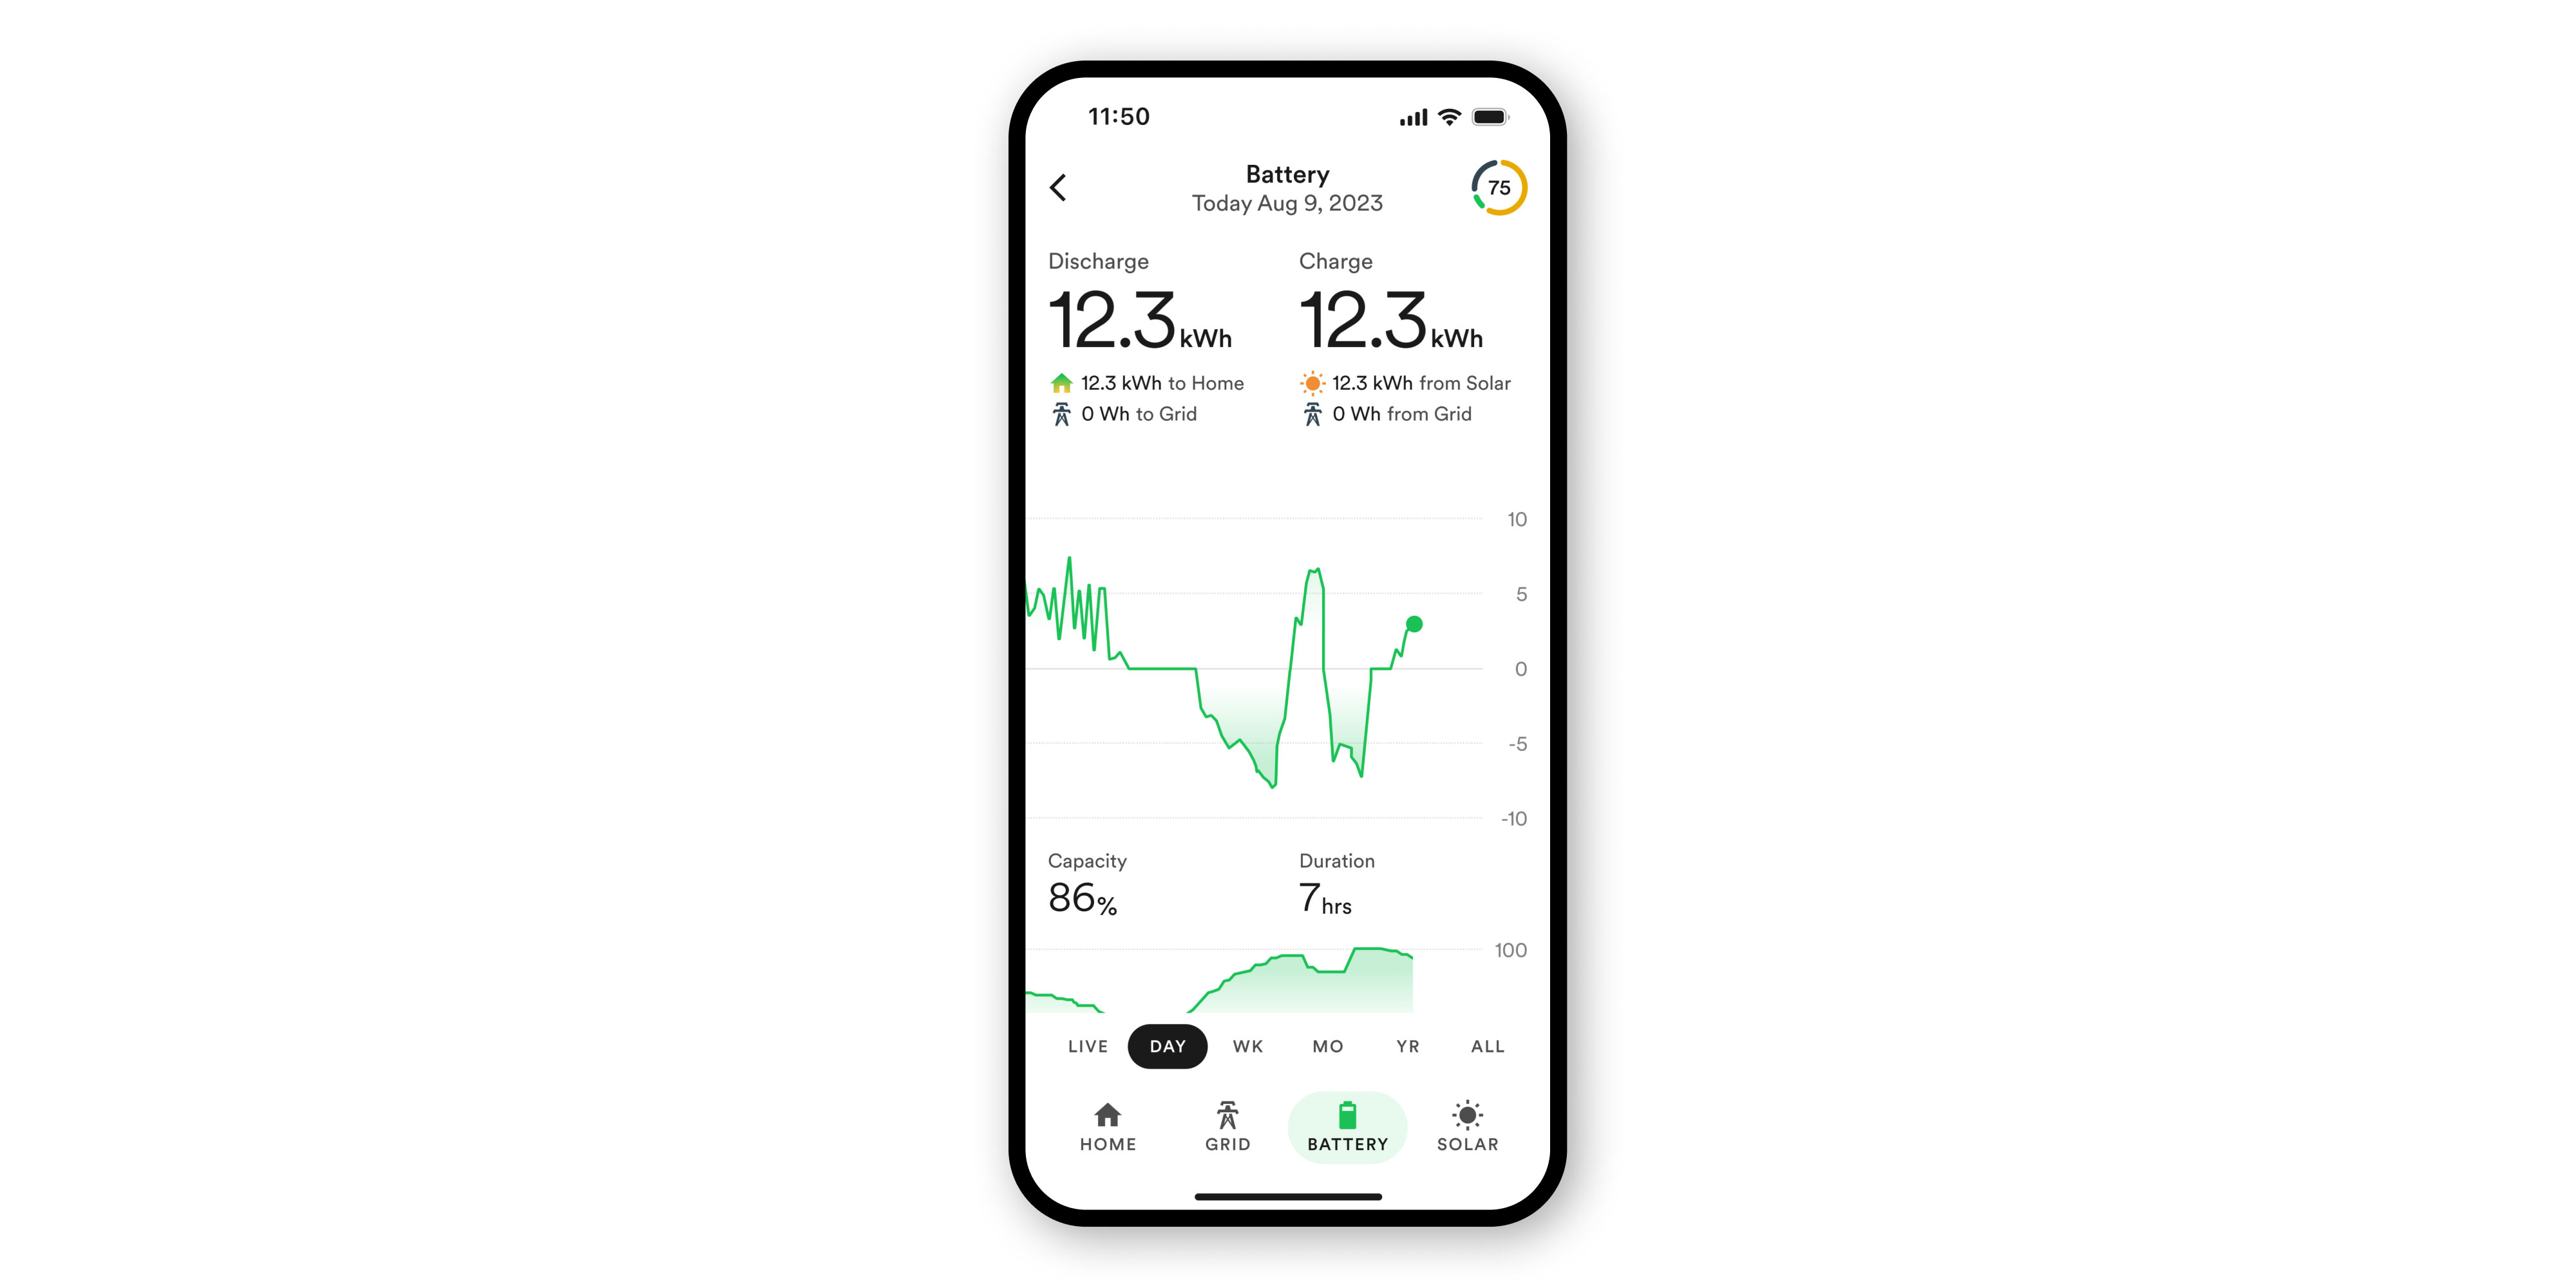
- The Battery Report shows the charge and discharge cycles of your battery, as well as its current capacity. It also tells you how much longer your battery will last based on your current usage, helping you keep key appliances running during power outages.
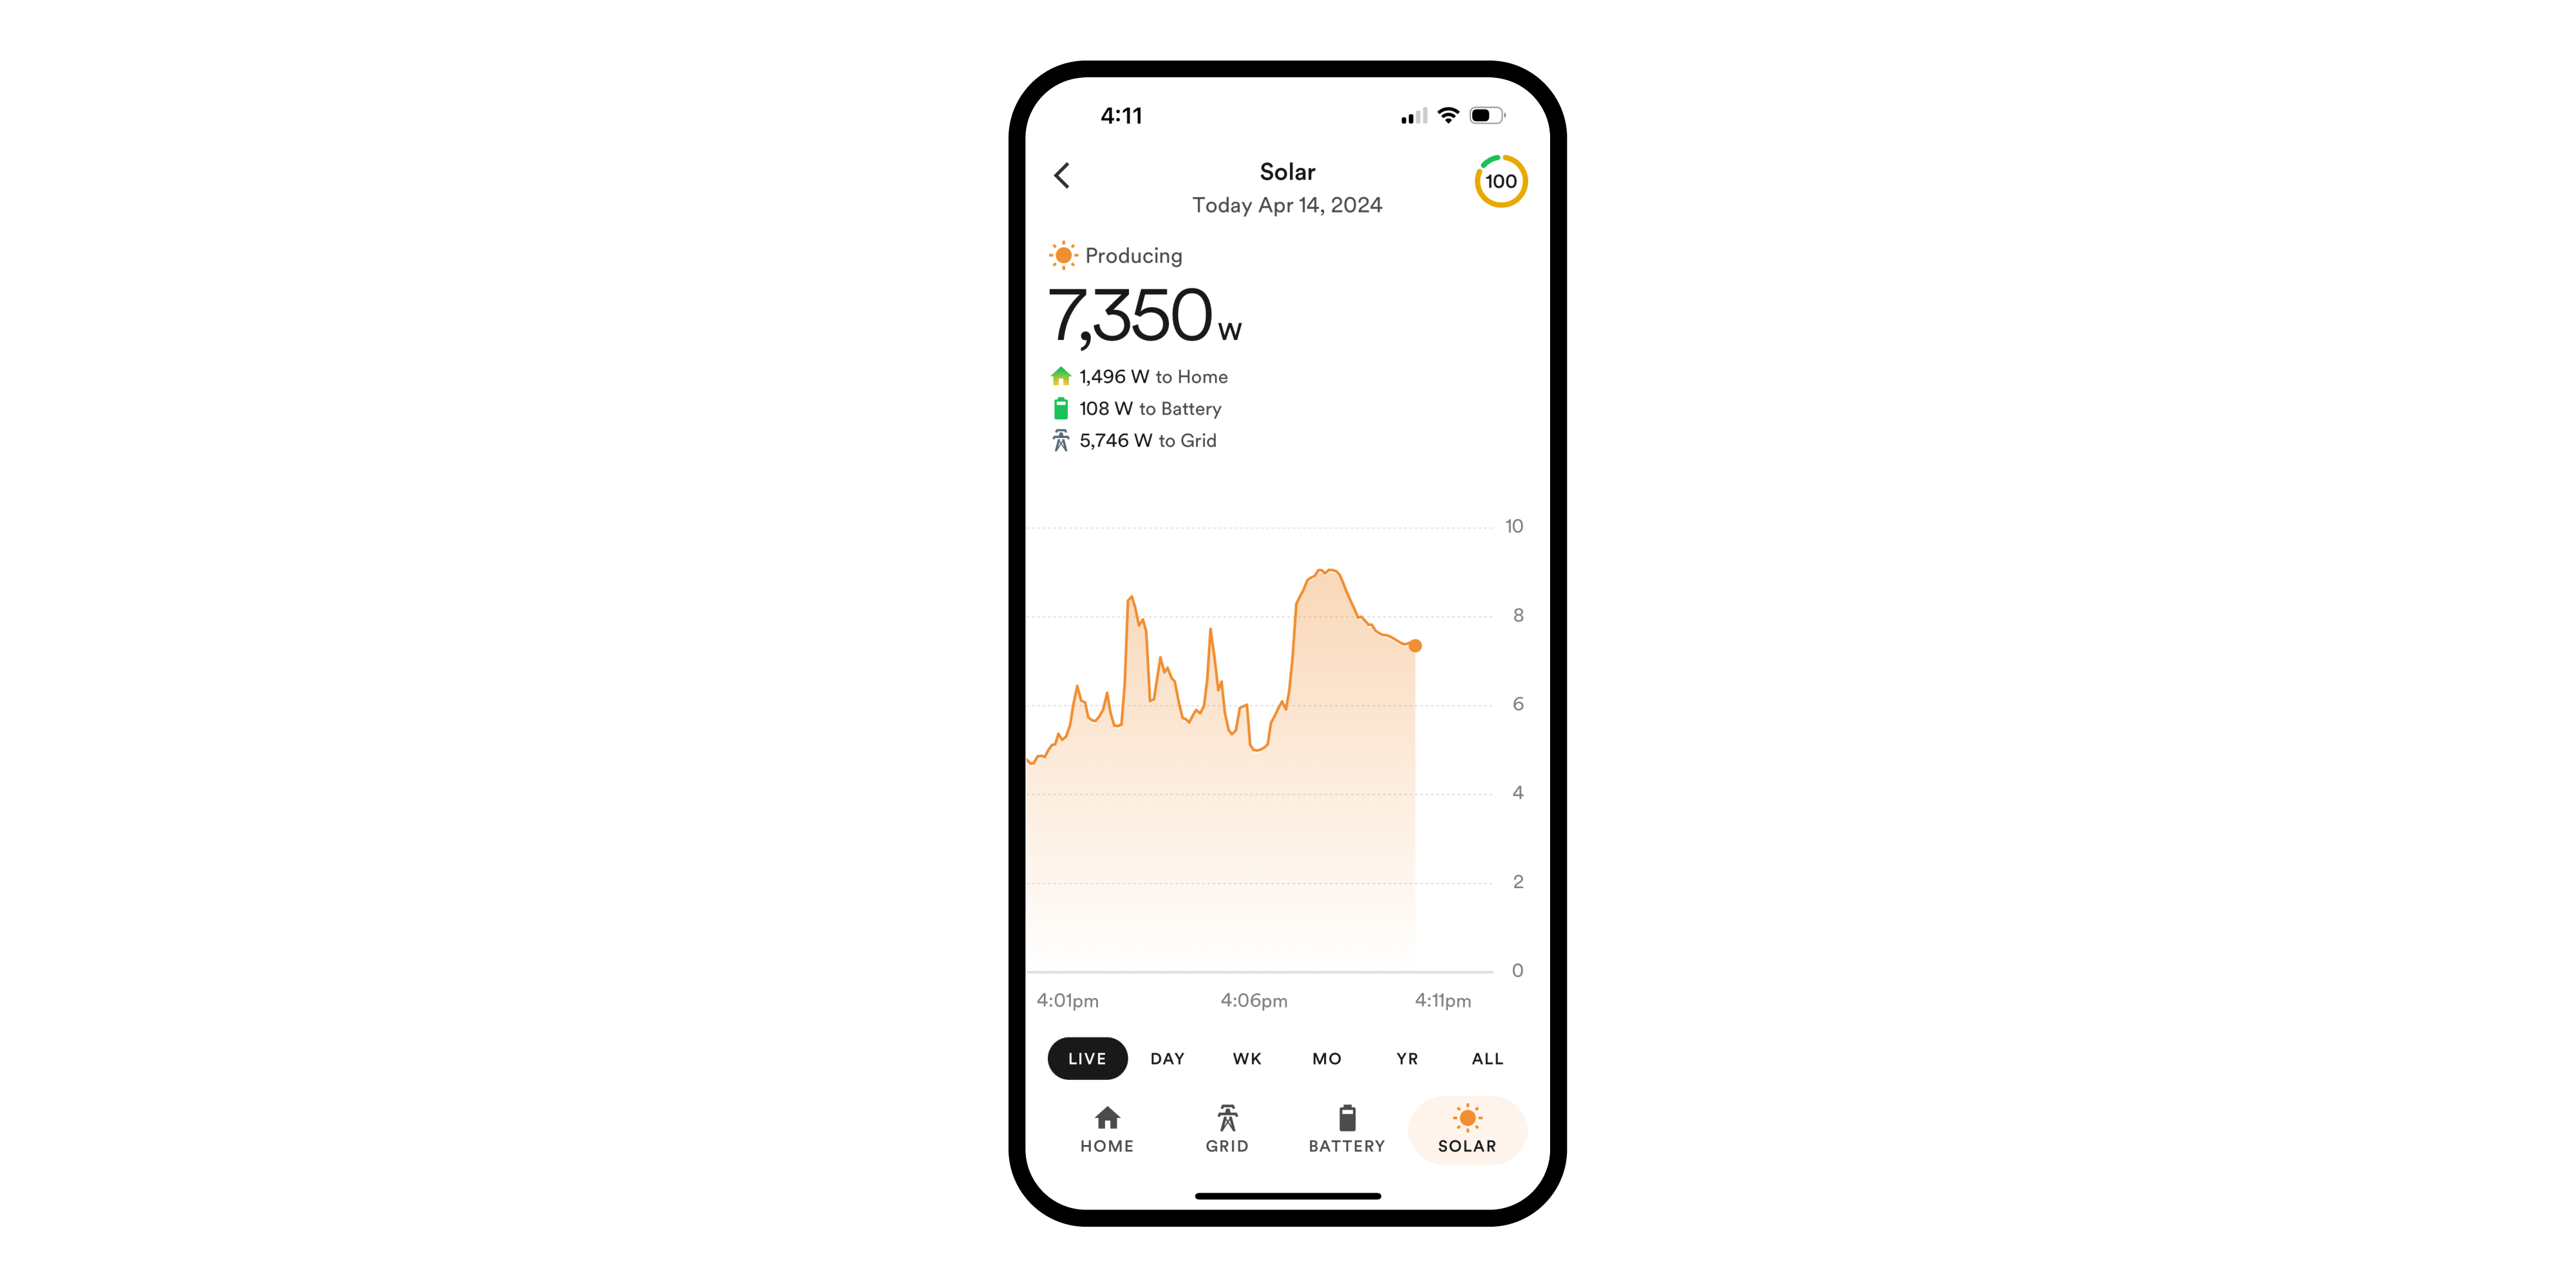
- The Solar Report shows how much renewable energy your system produced and whether this power was directly consumed, stored in your battery, or sent back to the grid.
You May Also Like

In The News
Rep. Celeste Maloy Visits Torus GigaOne Facility, Highlighting American-Made Grid Infrastructure
Congresswoman Celeste Maloy toured Torus’ new 540,000-square-foot GigaOne facility in Salt Lake City, spotlighting the company’s rapid manufacturing expansion and its role in delivering American-made, resilient energy storage systems to strengthen the U.S. power grid and supply chains.

In The News
2025 Wrap-Up and Look Ahead to 2026
From 99.99% uptime to 500 MW in utility partnerships to opening our new GigaOne manufacturing and assembly facility to growing our team to nearly 200 strong, we're accelerating the deployment of resilient power systems for our customers.